R-package
Competition from 16.10 (included) to 30.10 (included).
Report due for 30.10
Remember to forecast at least one day before the date
for which the forecast is intended, before 11pm at the latest.
Send your forecast before 8pm to receive
feedback information.
Use our discussion forum
for questions related to methods, implementations and potential bugs.
Objectives
The goal of this competition is to forecast the number of times a R-package
will be downloaded via CRAN (one of the major
repository for R packages). We are interested in particular with
the fpp2 package.
The accuracy of the forecasts is measured by the mean squared error: $$(x_t - \hat{x}_t)^2$$
The objectives of this case study are the followings:
- Learn to forecast with exponential smoothing and ARIMA models.
- Experience forecasting situation dynamically on day-to-day data.
- Deal with outliers and missing values.
- Work and progress in groups.
- Write a succint scientific report.
- Have fun while learning.
Data
The number of downloads of packages on CRAN are easily obtained using the cranlogs package.
To install it, you simply need to install the package of the course,
the cranlogs package will be automatically installed.
Otherwise, you can follow this example:
# if not installed, install the package of the course
devtools::install_github("SMAC-Group/fc2018")

# install the cranlogs package
devtools::install_github("metacran/cranlogs")
You can check the GitHub page of this package for more information and examples. Here are some examples:
# the total number of downloads of all packages from last week
cran_downloads(when = "last-week")

# the total number of downloads of all packages for a specific window of time
cran_downloads(from = "2017-08-01", to = "2018-08-01")

# the total number of downloads of `ggplot2` for a specific window of time
cran_downloads(from = "2018-07-01", to = "2018-08-01", packages = "ggplot2")
fpp2 package
Let’s turn our attention to the fpp2 package that we will forecast.
If you check the package’s archives, you can realize it was created on the 23rd of February 2017, so it is useless to retrieve data before. Let’s obtain the data up to today (12th of September 2018) and plot it:
fpp2 <- cran_downloads(packages = "fpp2", from = "2017-02-23", to = "2018-09-12")

# plot the time series
ggplot(fpp2, aes(x = date, y = count)) +
  geom_line() + xlab("Dates") + ylab("Number of downloads on CRAN") +
  ggtitle("Number of downloads of 'fpp2'")
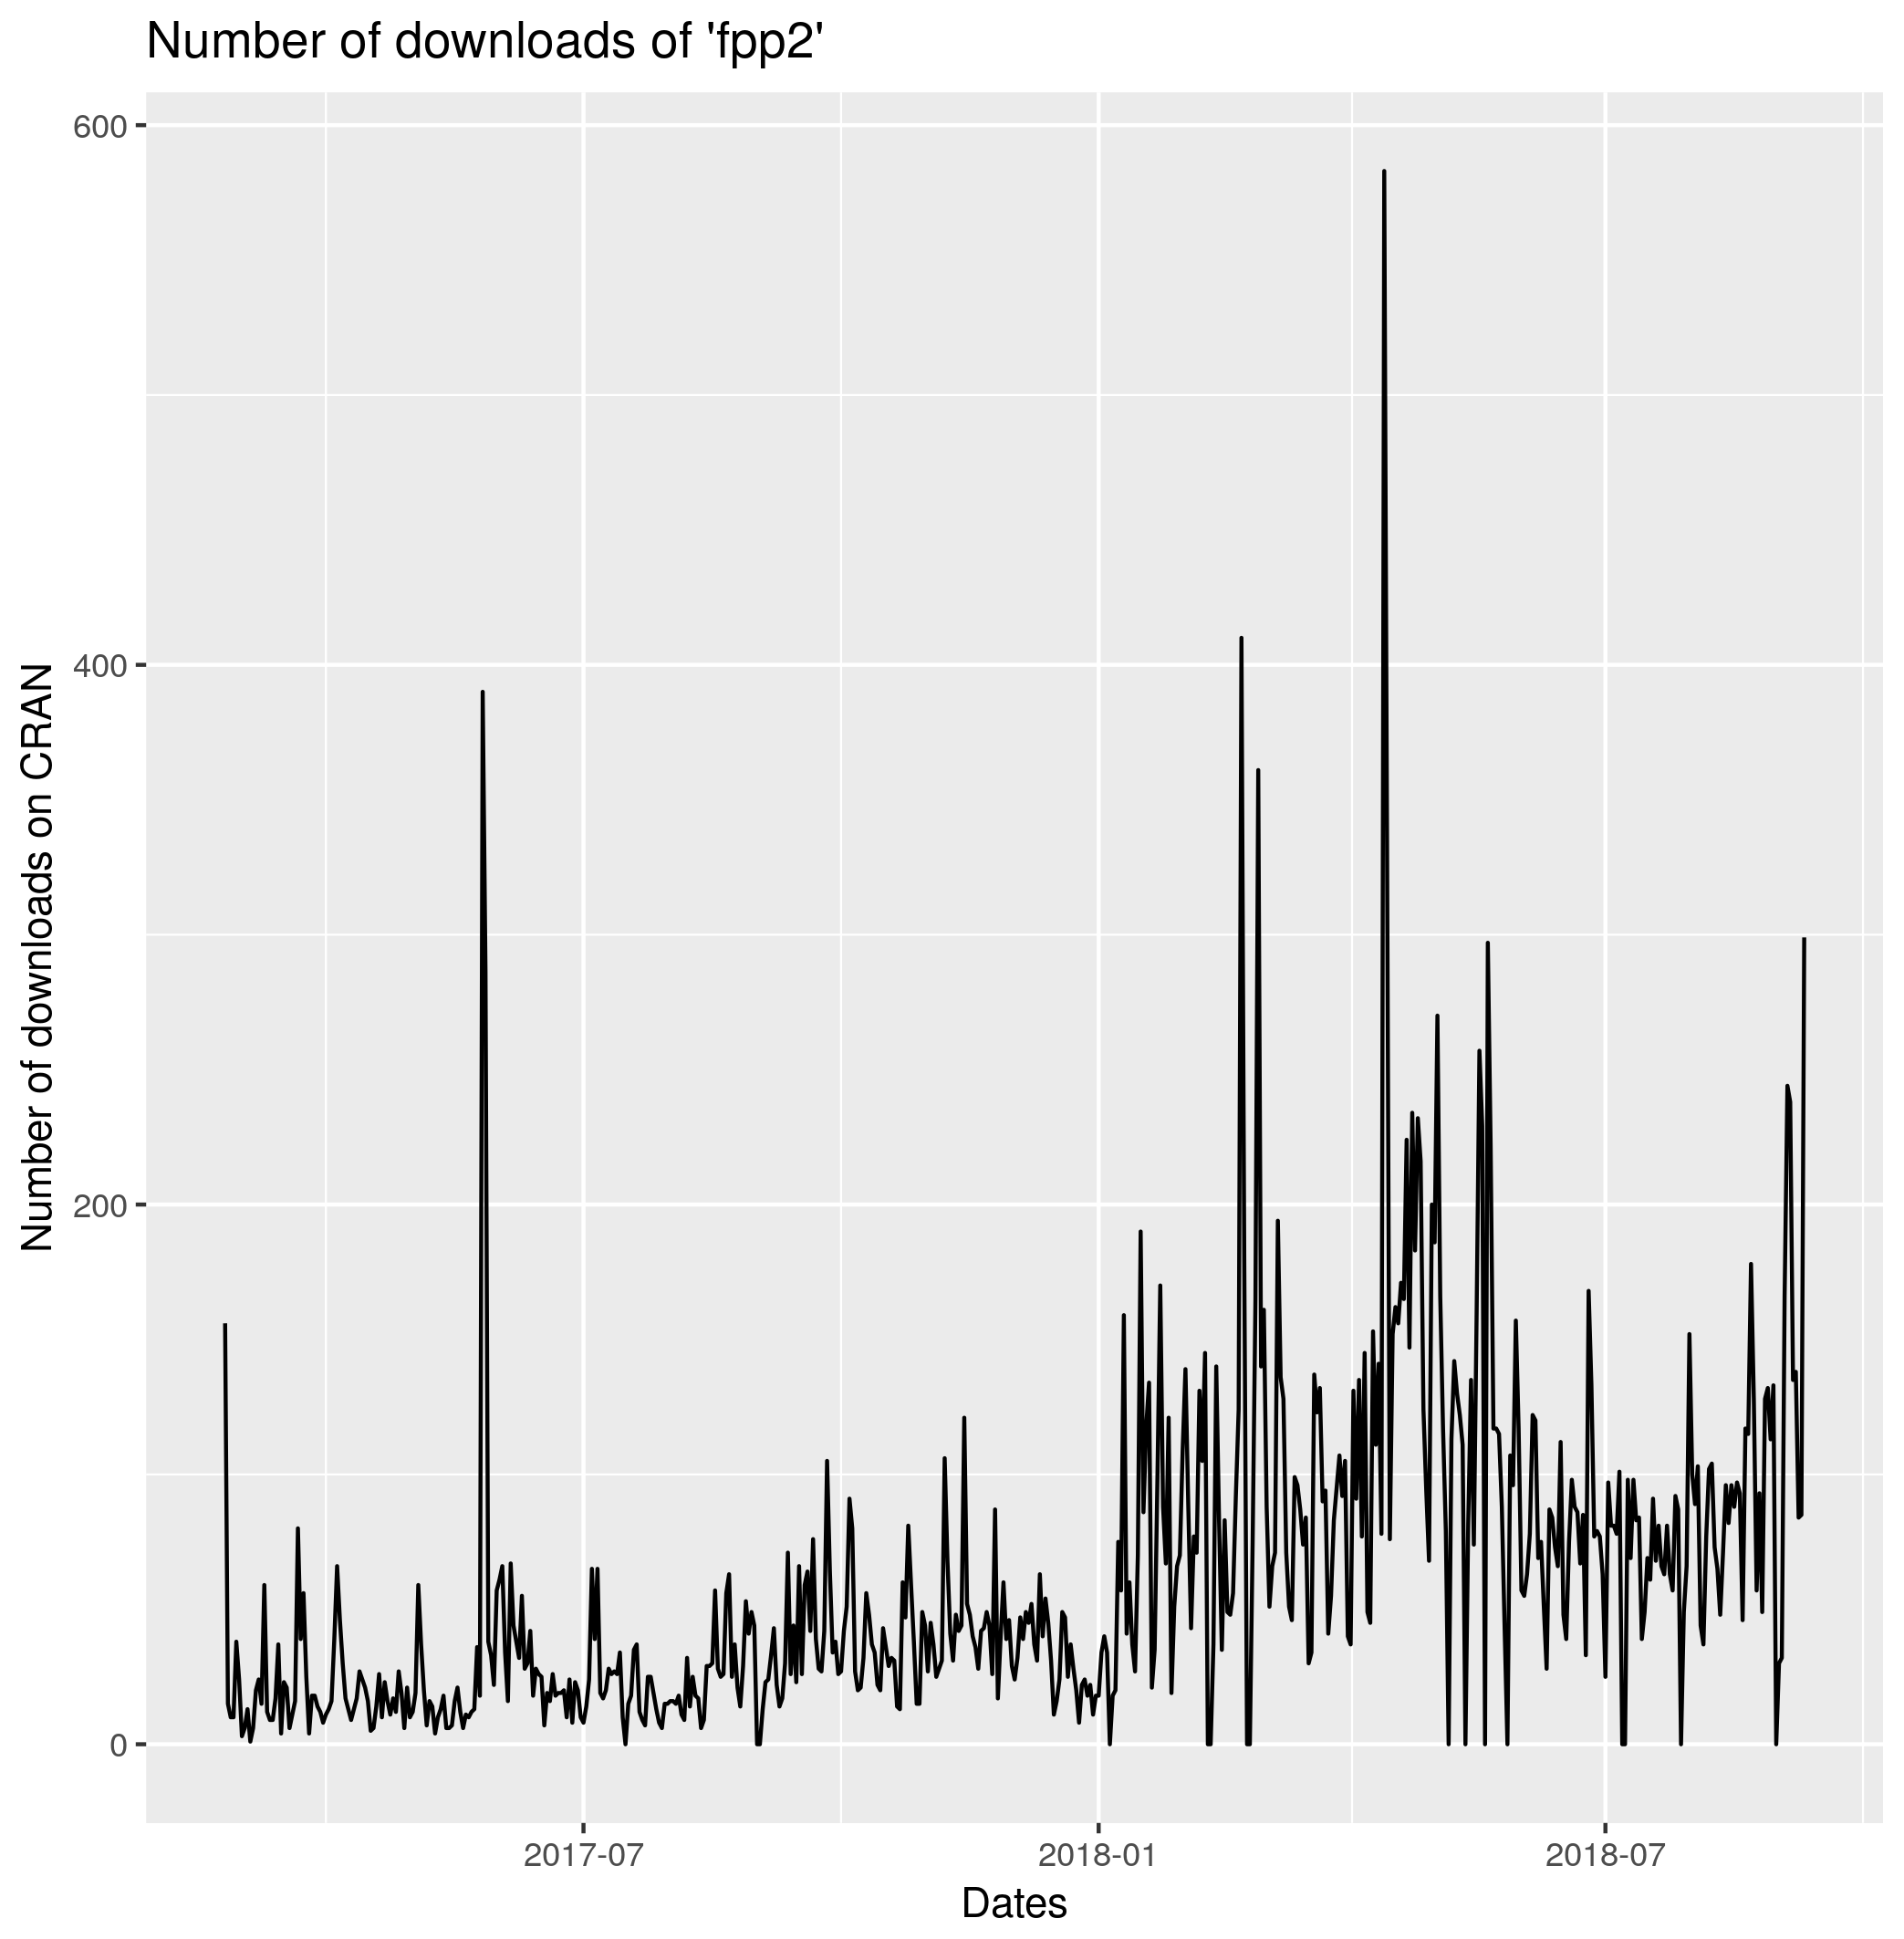
You can notice peeks and zeros appearing. These questions will be addressed in a future lecture.
results (update 30.10.2018)
| Date | Max | Lumia |
|---|---|---|
| 16.10 | 77.31 | 131.07 |
| 17.10 | 91.73 | 84.98 |
| 18.10 | 110.93 | 268.83 |
| 19.10 | $\emptyset$ | 104.14 |
| 20.10 | 0.01 | 22.87 |
| 21.10 | 147 | 100 |
| 22.10 | $\emptyset$ | 128.33 |
| 23.10 | 20.17 | 7.40 |
| 24.10 | 78.74 | 97 |
| 25.10 | $\emptyset$ | 55 |
| 26.10 | 18.47 | 155.89 |
| 27.10 | 156.78 | 11 |
| 28.10 | 20.77 | 30 |
Table: Absolute difference between forecast and realization.